

It's Our Nature to Know
-
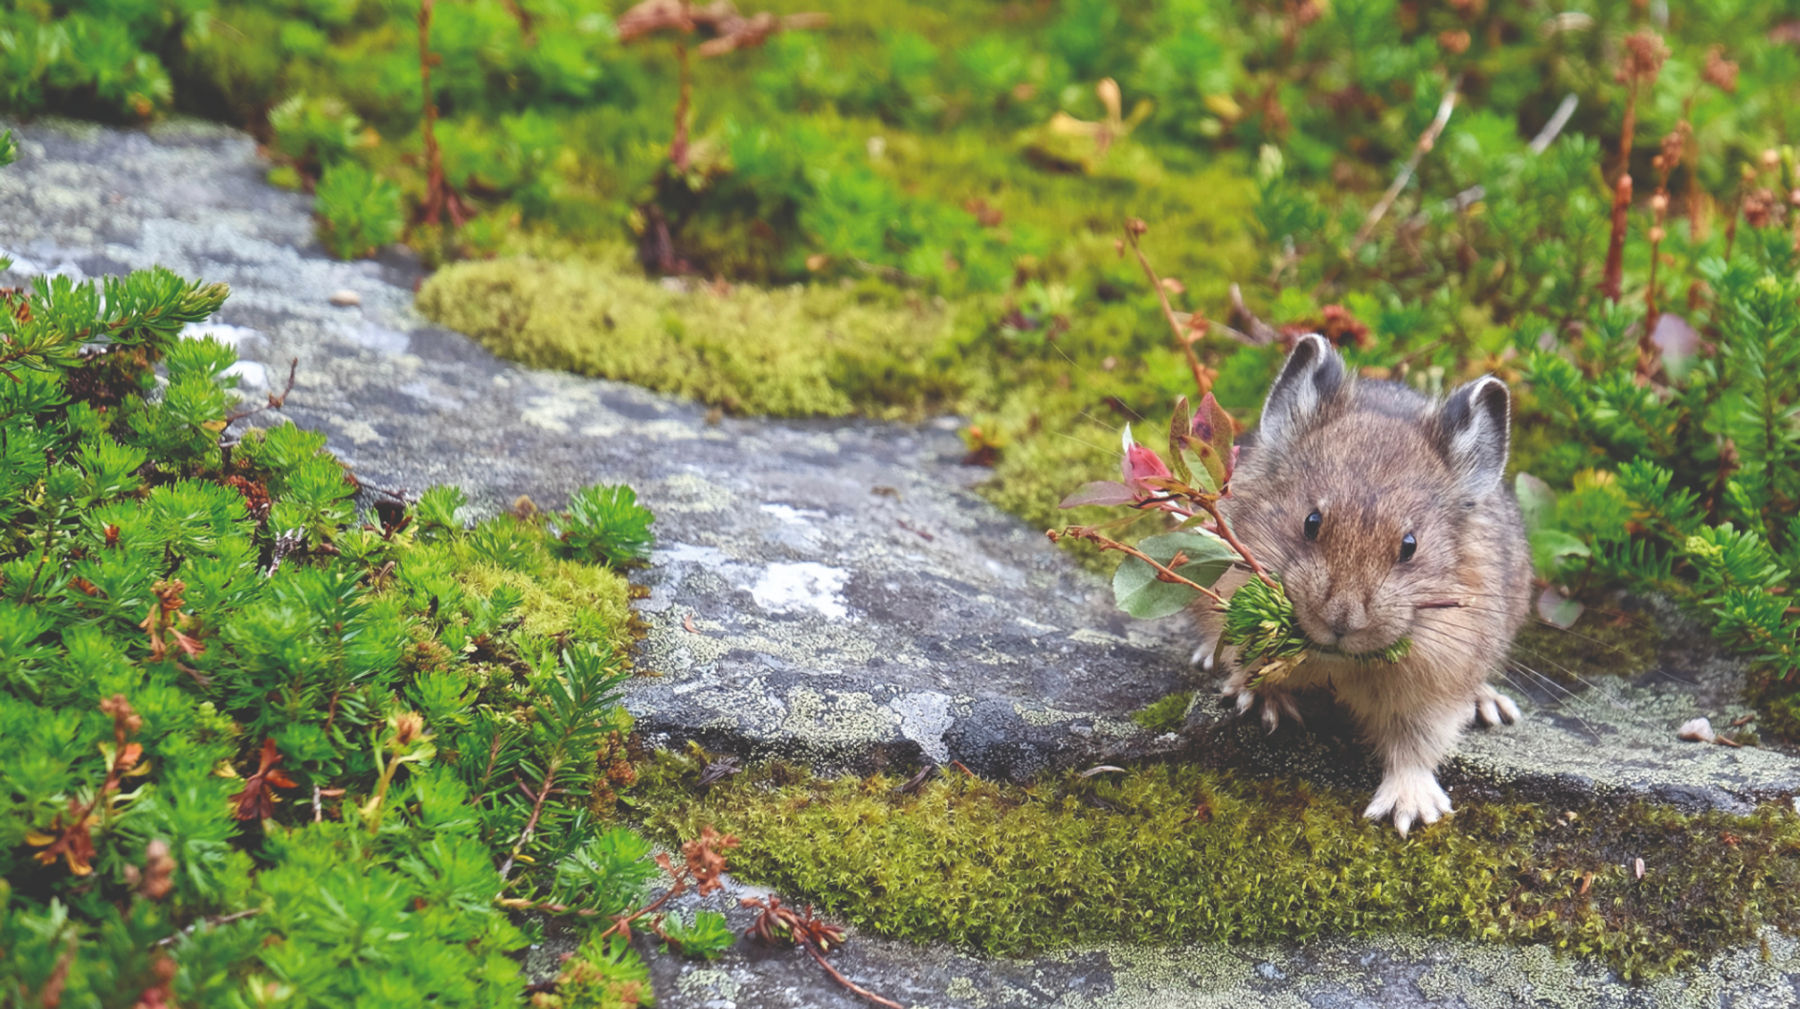
Explore Our Data and Resources
 Learn about Alberta's species and access our varied data products, mapping information, and acoustic data. It's all here!
 -
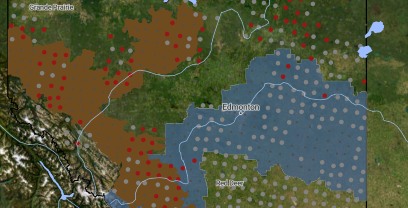
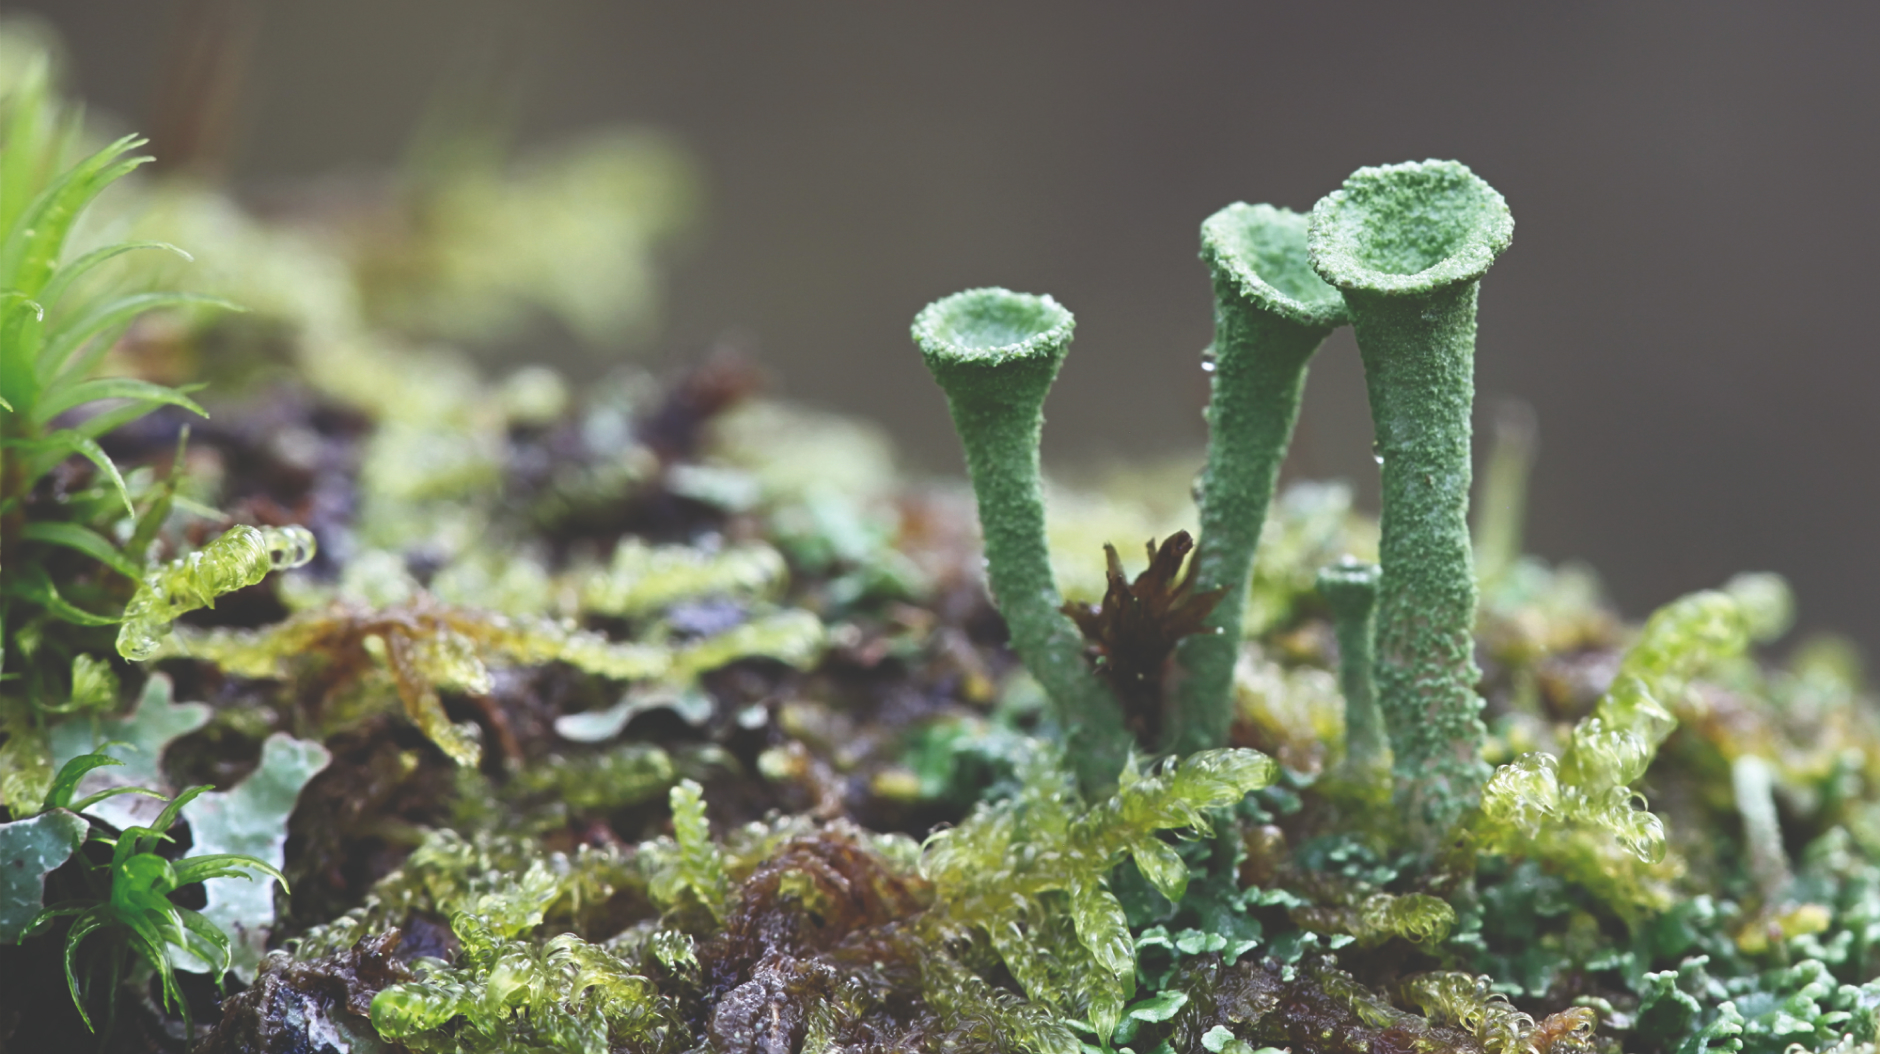
Explore our Publications and ProtocolsThis Science Letter looks at which habitats are represented in AB’s protected area network using different conservation targets.
-
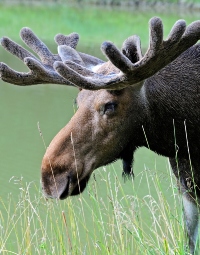
Discover Our Media and Story Hub
 The newest version of HawkEars has landed!...
 -
Discover our Media and Story Hub
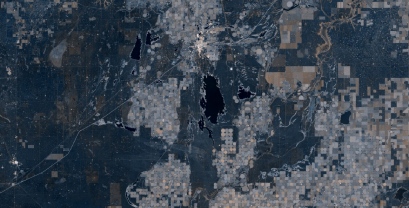
 Scientists at the ABMI's Imaging Centre are leveraging the power of remote sensing and machine learning...
We work collaboratively to provide ongoing, relevant and scientifically credible information on Alberta's living resources.
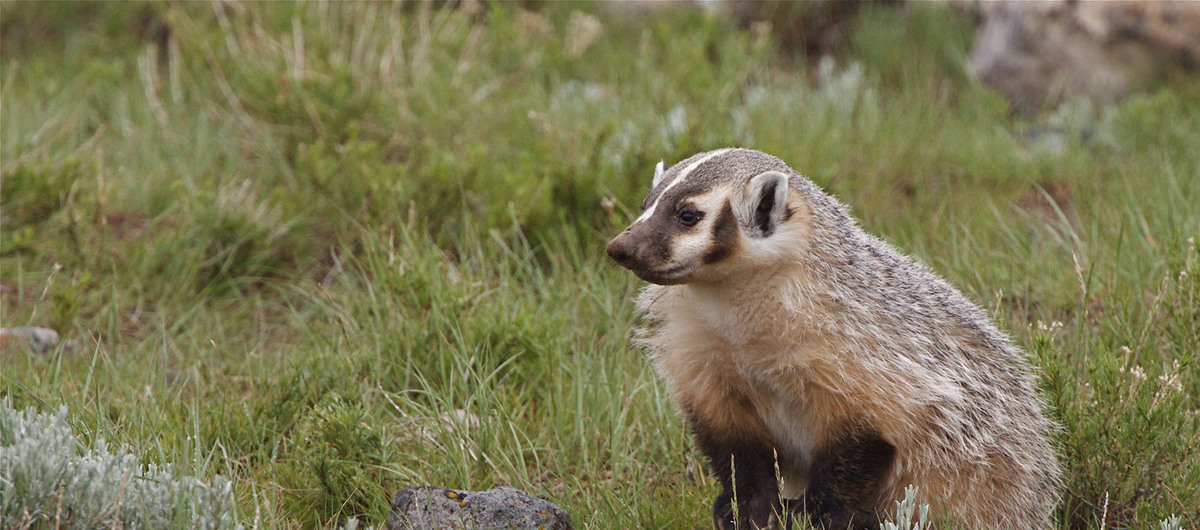
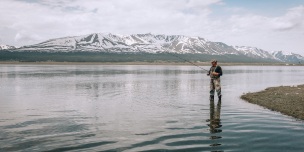
We're the Alberta Biodiversity Monitoring Institute (ABMI). We track changes in wildlife and their habitats across Alberta.
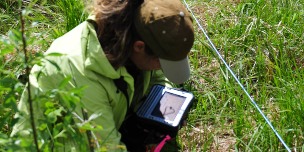
We collect data on Alberta’s species at sites across the province in an extensive field program.
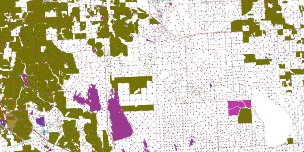
We use innovative approaches to map and monitor Alberta’s landscapes and human footprint.
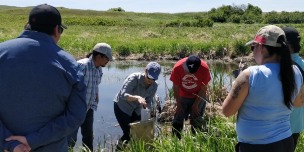
Together, we leverage each other’s strengths and expertise to deliver high-quality, scientific information.
We collect and share trusted information on biodiversity and landscapes to meaningfully understand the world around us.

We’re built around Open Data—the philosophy and practice of making data freely available, easy to access, and easy to use. Open Data helps to connect people and support transparency and collaboration in pursuit of balanced policies and informed conservation and management decisions.
All of our data and products are available for any use by any person or organization—always.
Alberta is home to diverse land uses and perspectives on our living resources. One constant need is for biodiversity and land cover information that’s reliable, trustworthy, and scientifically rigorous. We are an independent, arm’s-length scientific institution; our work is trusted by groups from industry and government to academia, Indigenous communities, and the general public. Focused on quality, collaboration, and accessibility to all, we let our data and products speak for themselves.
It's our nature to know—and yours, too. Explore all of the ABMI's open-access data and products.
.jpg)