Status and Trend Monitoring
Our core monitoring programs includes both long-term trend monitoring and short-term change detection, with the goal to understand the status and trend of species and land cover throughout Alberta, and communicate this information to support provincial and regional land-use decision-making.
Ecosystem Health Program
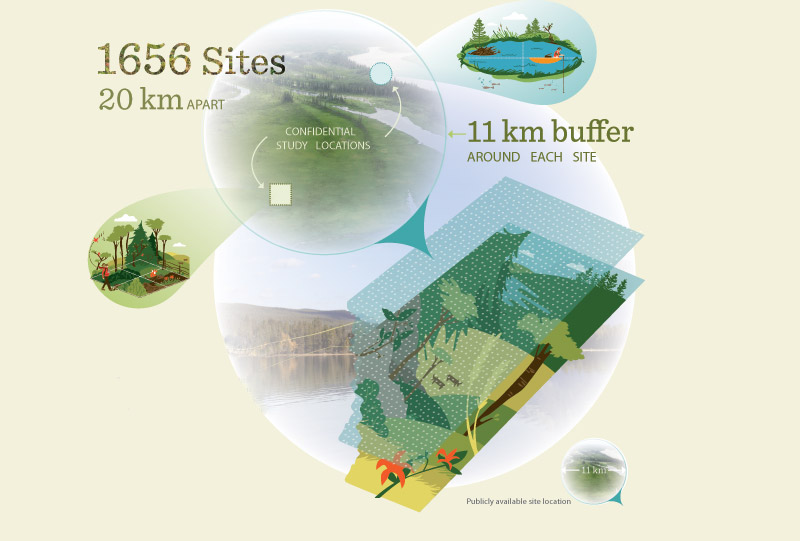
The Ecosystem Health program is founded on concepts of biodiversity status and trend monitoring. This core ABMI monitoring effort is comprised of 1,656 20-km gridded monitoring sites, a subset of which have been visited each year for nearly two decades. At each site visit, we record the observed species across a variety of taxa and measure a wide breadth of habitat characteristics. To capture long-term status and trend, we revisit sites approximately every 10-20 years. To capture short-term change from specific local and regional stresses in targeted habitats, we visit a small subset of the 20-km grid sites, as well as other off-grid targeted sites, every 5-7 years, in order to provide critical information on biodiversity and habitat change on timelines more suitable for land management applications.
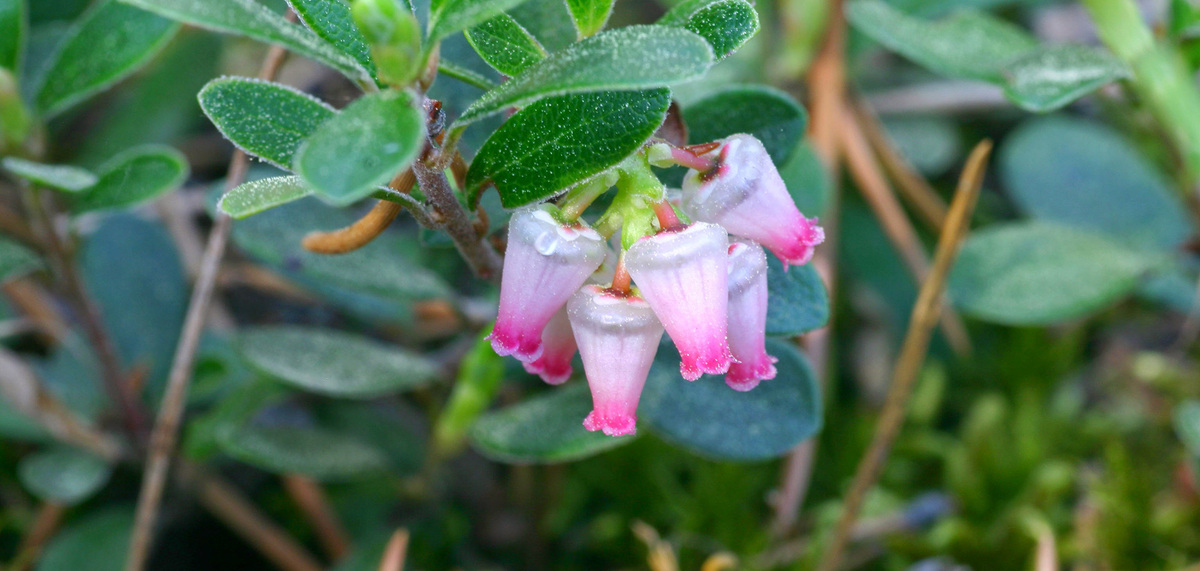
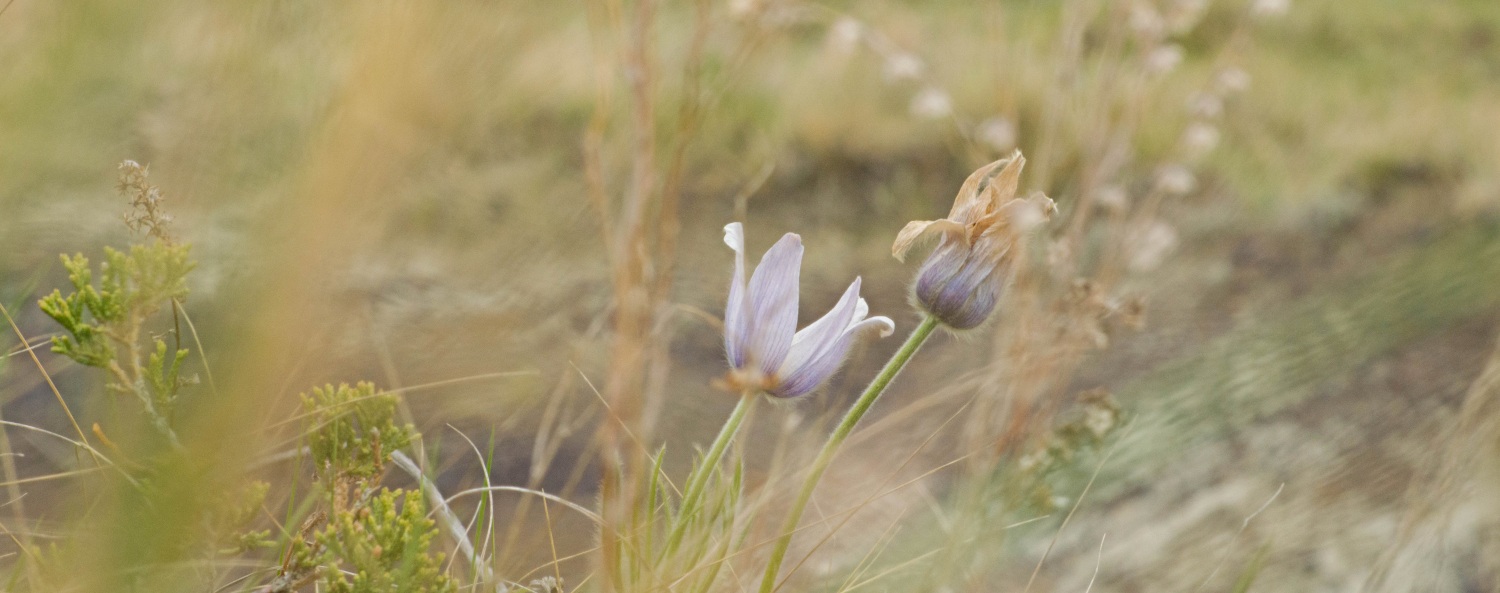
Biodiversity encompasses the sheer variety of life on earth: while you can’t measure everything, you also can’t use changes in any single species as a stand-in for changes in the whole. We collect information on mosses, lichens, soil mites, vascular plants, mammals, birds, amphibians, and aquatic invertebrates. These groups have well-established utility as environmental indicators; humans may be interested in and rely on the ecosystem services they provide; and we are able to reliably detect changes in these species communities.
Ecosystem Health Program Protocols
- Classification of ecosite and forest stand characteristics
- Tree core collection and dendrochronology
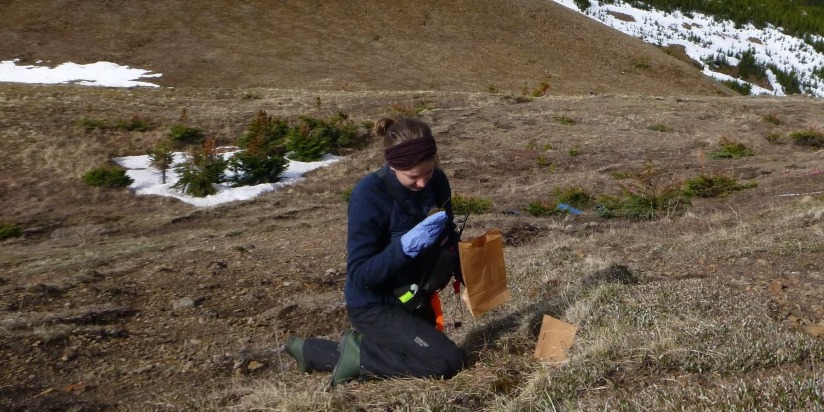
- Soil core collection for soil mite identification and soil chemistry analysis
- Bryophyte and lichen collection
- Vascular plant identification and collection
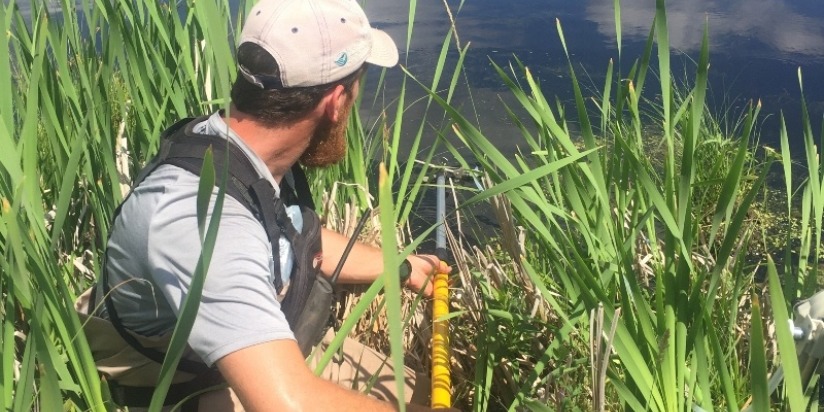
- Classification of ecosite and wetland characteristics
- Wetland mapping (bathymetry and wetland zones)
- Water physiochemistry analysis
- Freshwater invertebrate collection
- Vascular plant identification and collection
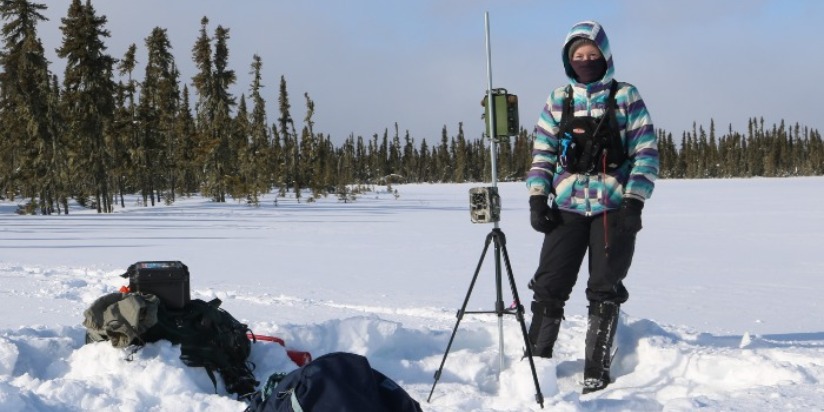
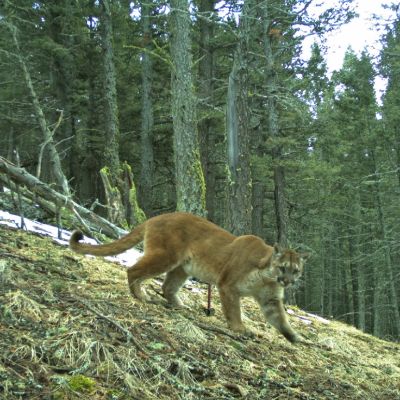
- Deployment of remote cameras and autonomous recording units (ARUs) at each terrestrial site in winter ahead of field season, followed by retrieval in late summer
- Monitoring Alberta's mammal, bird, and amphibian populations after reviewing thousands of photos and hundreds of hours of recordings
Biodiversity Intactness Index
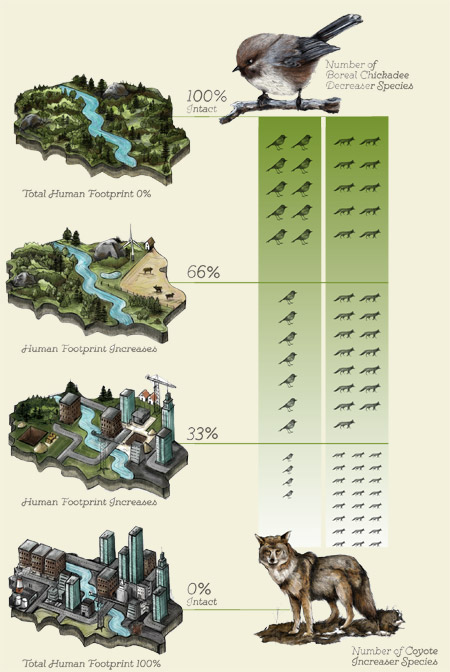
We use data on biodiversity collected at each site to create a standardized metric known as the Biodiversity Intactness Index. This index tells us whether species and habitat elements are as abundant, less abundant, or more abundant than would be expected given the same landscape but undisturbed by human footprint. This in turn provides insight into potential relationships between biodiversity and underlying factors like human footprint.
The Biodiversity Intactness Index ranges from 0% to 100%. At 100%, the abundance of a species is equal to the abundance expected in an undisturbed area—one with no human footprint. As the index declines toward 0%, it reflects a change in the abundance of a species in response to human footprint (in either a positive or negative direction):
- The chickadee, a “decreaser” species, is expected to be less abundant as human footprint increases.
- The coyote, an “increaser” species, is expected to be more abundant as human footprint increases.
An intactness “score” does not represent when a population is most abundant. Rather, it reflects changes from conditions with no human footprint.
Download a fact sheet with an overview of how we calculate intactness, from data collection to the final output. Further technical details are available in the Manual for Species Modeling and Intactness in the publications archive.
Applying our Data
The Ecosystem Health Program contributes to the accumulation of a species-level data set that lets scientists and policy-makers understand species-habitat relationships and determine how human activity on the landscape is affecting the abundance and distribution of hundreds of species. It can confirm if management actions are effective, and provide insight into what changes might be needed when desired outcomes are not being attained.
We can use data from the Ecosystem Health Program to report on biodiversity in regions of interest. For instance, you can read our recent reports on the status of biodiversity and land cover in different Forest Management Agreement (FMA) areas of Alberta in our Online Report section.
Making Information Accessible
The Biodiversity Browser is a one-stop shop to see what species we have detected where, their habitat associations, and predicted changes in their abundance due to habitat changes.
Our Mapping Portal lets you build custom maps using ABMI data and geospatial layers. Data on human footprint, wetlands, species detections at our monitoring sites, and more are all available to display. Data from our monitoring programs is also used to create more derived layers available on the Mapping Portal, such as “habitat value” layers showing old-forest bird habitat suitability or predicted non-native plant richness.
You can freely download any and all of our data through our Open Data Portal. Data from the Ecosystem Health Program are associated with buffered site locations; learn more about our site confidentiality policy here.
The ABMI provides the tools to ensure that biodiversity is sustainably managed and remains a proud inheritance for future generations of Albertans.
.jpg)
In the spring of 2020, the ABMI initiated a pilot project with Innotech Alberta to explore the effectiveness of environmental DNA (eDNA) technology for monitoring amphibians in wetland habitats.
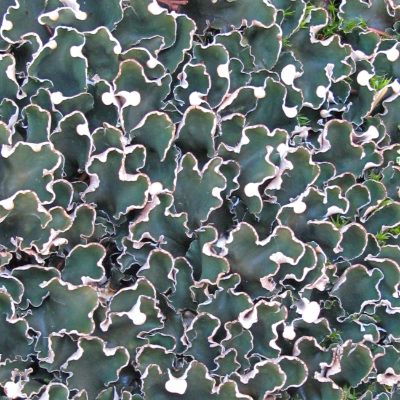
The Peltigera project aims to expand our understanding of Peltigera lichen diversity in Alberta through genetic markers. Building on the research done by global Peltigera experts, we hope to use genetic data to both verify our identifications and detect new species to the province.
The Alberta Remote Camera Steering Committee (RCSC) is building scientific understanding and effectiveness of remote camera surveys to benefit a broader network of remote camera researchers and practitioners in western Canada.
Use our Biodiversity Browser to see profiles on all the species we monitor in Alberta.