Improved Habitat Monitoring in Alberta using Lidar and Machine Learning in Wellsite Identification
Scientists at the Alberta Biodiversity Monitoring Institute’s (ABMI) Imaging Centre are leveraging the power of an impressive partnership: remote sensing (lidar1) and machine learning. By combining these advanced technologies, imaging experts can now automatically and accurately delineate the outlines of wellsites in the boreal forest of Alberta; proving to be a boost to the science of land mapping as well increasing the level of detail of existing land-use maps. This work marks an important step in assessing vegetation regeneration and is an indicator of habitat recovery and of the impact of oil and gas exploration in the province. Dr. Mustafiz Rahman, director of the ABMI’s Imaging Centre explains, “the ultimate goal is to develop a comprehensive and reliable geodatabase on vegetation structure and composition, enabling data-driven decision-making for land management and conservation efforts.”
As key operating areas for the oil and gas industry, wellsites are typically built by first clearing vegetation, then preparing the site for drilling rigs and finally installing the associated equipment used in the extraction of oil, bitumen, or natural gas. The size and boundaries of wellsites can vary greatly depending on the depth and the type of well being drilled. By improving mapping precision through automated detection and accurate delineation of wellsites, it becomes possible to more accurately assess vegetation regrowth and land disturbance on and around wellsites across the province. In 2022, the ABMI reported approximately 350,000 wellsites in Alberta, which house approximately 463,927 licensed wells according to the Alberta Energy Regulator (AER)2. Other provinces in Canada have significantly fewer wellsites—in the same year, British Columbia reported 9,988 active wellsites3—underscoring Alberta’s position as hosting Canada’s largest number of wellsites.
How They Did It
Manually delineating the accurate boundaries of wellsites across the province would be by every calculation a mammoth task. Undeterred, the Imaging Centre’s team devised a strategic solution that began with taking advantage of the ABMI’s Human Footprint Inventory (HFI) as reference data. The HFI dataset already presented a large amount of reliable information on wellsites and was created and digitized using three different methods: 1) Data buffered by the Government of Alberta using intelligent buffering based on the type of wellbore. 2) Use of the wellsite’s existing disposition boundary or defined area for oil and gas activities and 3) Manually digitizing wellsite locations using medium-high resolution satellite or SPOT imagery. Later, wellsites in the HFI are verified and attributed using AER wellbore data or disposition datasets.
The team combined this HFI data and relevant lidar-derived products with machine learning to generate accurate boundary boxes around wellsites. They developed a two-step process: first, detecting wellsites, and second, delineating their accurate boundaries.
Step 1: Wellsite Detection
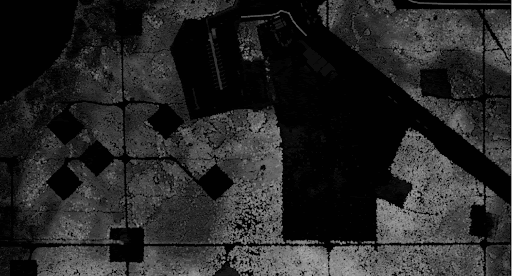
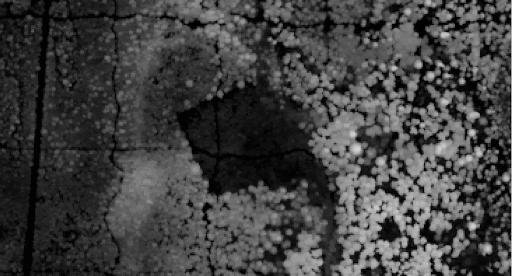
The first step in mapping wellsites more precisely was to automatically detect their locations using existing data. The team used two lidar-derived products: the Canopy Height Model (CHM), which represents the 3D structure of the forest canopy, and lidar intensity, which measures the brightness of the ground surface. Together, these datasets helped identify areas where vegetation had been cleared—strong indicators of wellsite locations. These data were fed into a machine learning model trained to recognize the typical shape and characteristics of wellsites. Once trained, the model was able to automatically draw bounding boxes (shown in red in the image below) around areas it identified as wellsites.
By overlaying the model’s predicted boxes onto the ABMI’s 2021 HFI, the team confirmed that they had developed a solid foundation for the wellsite delineation work taking place in the next step.
Green box: Human Footprint Index boundary box / Red box: Predicted boundary box
“By increasing mapping precision and automating the delineation of wellsites, we aim to provide more reliable insights into vegetation regrowth and land disturbance.”
Karansinh Padhiar, Machine Learning Scientist
Step 2: Wellsite Delineation
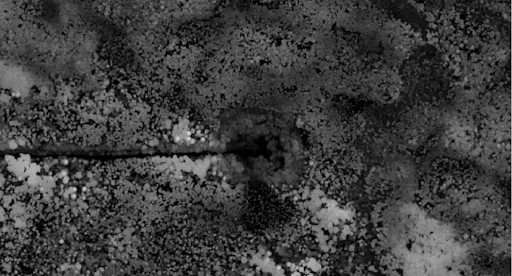
For the next step—precise segmentation of wellsites—the team used the detection results from Step 1 as inputs to their workflow. They then applied a custom region-growing algorithm, which begins at the center of each detected wellsite and expands outward to form a polygon.
This expansion is guided by predefined conditions for detecting abrupt changes in vegetation height, derived from lidar data. When the algorithm detects a significant change—typically where vegetation resumes—it stops growing and defines the outer boundary of the wellsite. The result is a new, more accurate predicted boundary for each wellsite, reflecting its actual footprint on the landscape. In turn, this allows for the assessment of the status of vegetation on the wellsite compared to surrounding vegetation.
A custom region growing algorithm.
Why this Method Works
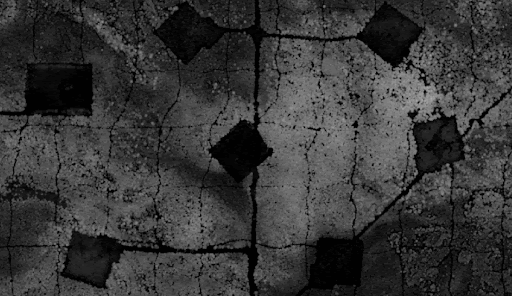
When comparing the original delineation in the HFI with the predicted delineation, we can see a marked difference. The predicted boundary box is a more precise and nuanced polygon. The team also applied noise-reducing algorithms for the data in order to ensure the bounding boxes were as smooth and optimized as possible. This method is advantageous in that it makes the bounding boxes of the existing wellsites much more accurate. This method also has the potential to reduce the workload for technicians if they were to manually delineate footprint data for wellsites.
Results: Green bounding box: HFI data / Blue bounding box: predicted data
The algorithm performs best when wellsites have lower vegetation regrowth compared to the surrounding area. It also incorporates normalized intensity values, where applicable, to enhance delineation accuracy.

Results: Green bounding box: HFI data / Blue bounding box: predicted data
Refining Accuracies: Challenges and Corrections
In a project of this ambition—combining human expertise, vast spatial data, machine learning, and a large geographic area—some challenges were inevitable. The team encountered a small number of false positives (incorrectly identified wellsites), false negatives (missed wellsites), and difficulties accurately delineating overgrown wellsites where vegetation regrowth blurred the boundaries.
While these issues were relatively limited, addressing them was key to improving the model’s accuracy and ensuring reliable results for various land management goals.
False-positive Detections
Some false positives occurred in areas such as river channels or industrial sites, where sparse surrounding vegetation mimicked the cleared appearance of wellsites. The team applied an automatic pre-filtering process to remove detections that fell below expected perimeter-to-area ratios. Any remaining anomalies were flagged and removed during manual quality control.
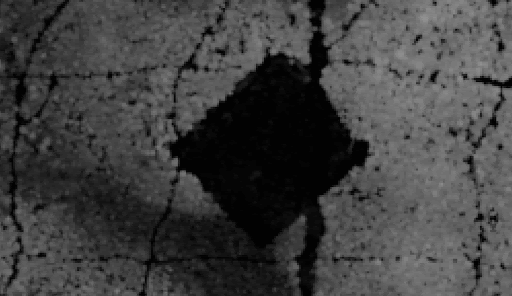
Overgrown Wellsites
In cases where wellsites were moderately to heavily overgrown, the algorithm struggled to draw precise boundaries. This is because the region-growing algorithm is designed to stop expanding when it detects a sharp increase in canopy height—a signal that may be obscured in regrown areas.
In contrast, the original HFI dataset typically includes the entire area of the wellsite, including vegetation regrowth. In these cases, having access to both the predicted boundaries and the HFI data can be valuable, depending on the user’s objective. Manual editors are able to flag and correct these inconsistencies as needed.
Example of an overgrown wellsite.
Overall Results and Next Steps: Accurate Automated Detection and Refining Algorithms
The project successfully demonstrated that combining lidar data with machine learning enables accurate automated detection and delineation of wellsites across the province. While some challenges remain, such as false positives and difficulty delineating overgrown wellsites, the overall approach significantly improves mapping precision and efficiency compared to manually updating the boundaries of each wellsite. Moving forward, the team will focus on refining algorithms to better handle complex cases, reducing classification errors, and developing an operational workflow to enable consistent, province-wide high resolution delineation of the existing wellsite inventory. This will present compelling opportunities when combined with lidar-based assessment of vegetation regeneration on wellsites that will support land management, monitoring, reclamation and conservation efforts.
To find out more about this project please contact abmiinfo@ualberta.ca
________________________________________________________________________________________
- Light Detection and Ranging (lidar) used lasers to actively produce light energy, making it an active remote sensing system. A lidar system can map and measure topography and uses light energy emitted from a rapidly firing laser to scan a surface and measure the heights of objects, like vegetation (trees) and buildings on the ground. Lidar also works with the global positioning system (GPS) to identify the location of those objects on the ground. The reflected light energy then returns to the lidar sensor where it is recorded and the lidar system can then process, analyze and apply that information to create accurate images of a designated area.
- Alberta Energy Regulator: Well Status
- British Columbia’s Oil and Gas Reserves and Production Report 2022